Roadmap reports
A roadmap report combines a nested entity tree with a shared time axis. Use it when timing, milestones, and sequence matter more than totals or card layout.
Typical examples:
- Application lifecycle by application or business domain.
- Capability -> application -> project transition plans.
- Transformation streams with child work packages and milestone markers.
Roadmap reports use the same relation-path, direction, and hop-count model described in Reports overview. The roadmap-specific difference is the output: instead of nested cards, each matched entity becomes a row in a split tree-and-timeline view. If the structure matters but time does not, use landscape reports. If you need totals or ranking, use bar charts.
Building roadmap layers
Pick a root layer that matches the viewpoint you want to organize around, then add connected child layers until the roadmap answers the question you care about.
Each non-root layer defines both the entity type and the direction from its parent. On top of that, each layer can map optional timing fields:
Startfor when the row begins.Endfor when the row finishes.Milestonesfor important point-in-time markers.
This makes it easy to build reports such as capability -> application -> project, where each level can use different date fields.
Each layer also has an Auto nest children option. When enabled, Caplo follows downstream Child of relations from that layer and renders those descendants as extra nested rows before the next configured layer. This is useful for hierarchies such as transformation stream -> work package -> sub-work package without configuring every intermediate level manually.
Timing and viewport
Roadmap reports render a shared quarter-based timeline across all visible rows.
- Rows with explicit start and end values render their own interval directly.
- Parent rows can still show a useful bar when one side is missing, because Caplo derives the parent range from child rows and keeps the same side open when any child is open-ended there.
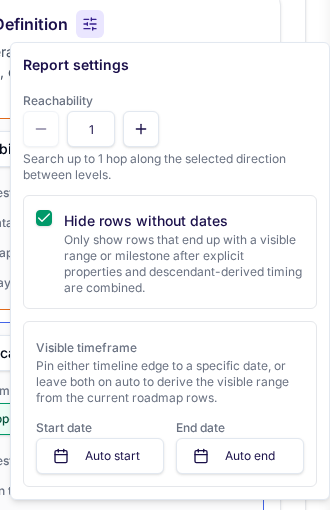
- Report settings let you pin the visible timeline start and end dates when you want a stable viewport for recurring reviews.
Hide rows without dateskeeps the roadmap focused when you only want rows that already carry usable timing.
Built-in starting point
The built-in Application lifecycle report is a roadmap template. Open Edit there if you want a ready-made starting point for application phase-in and phase-out dates, then save it as your own custom roadmap.
Timeline edit mode
Saved custom roadmaps, plus the built-in lifecycle viewer, include a viewer-only Edit dates mode. Turn it on when you want to seed or clean up start and end dates directly from the roadmap instead of opening entities one by one.
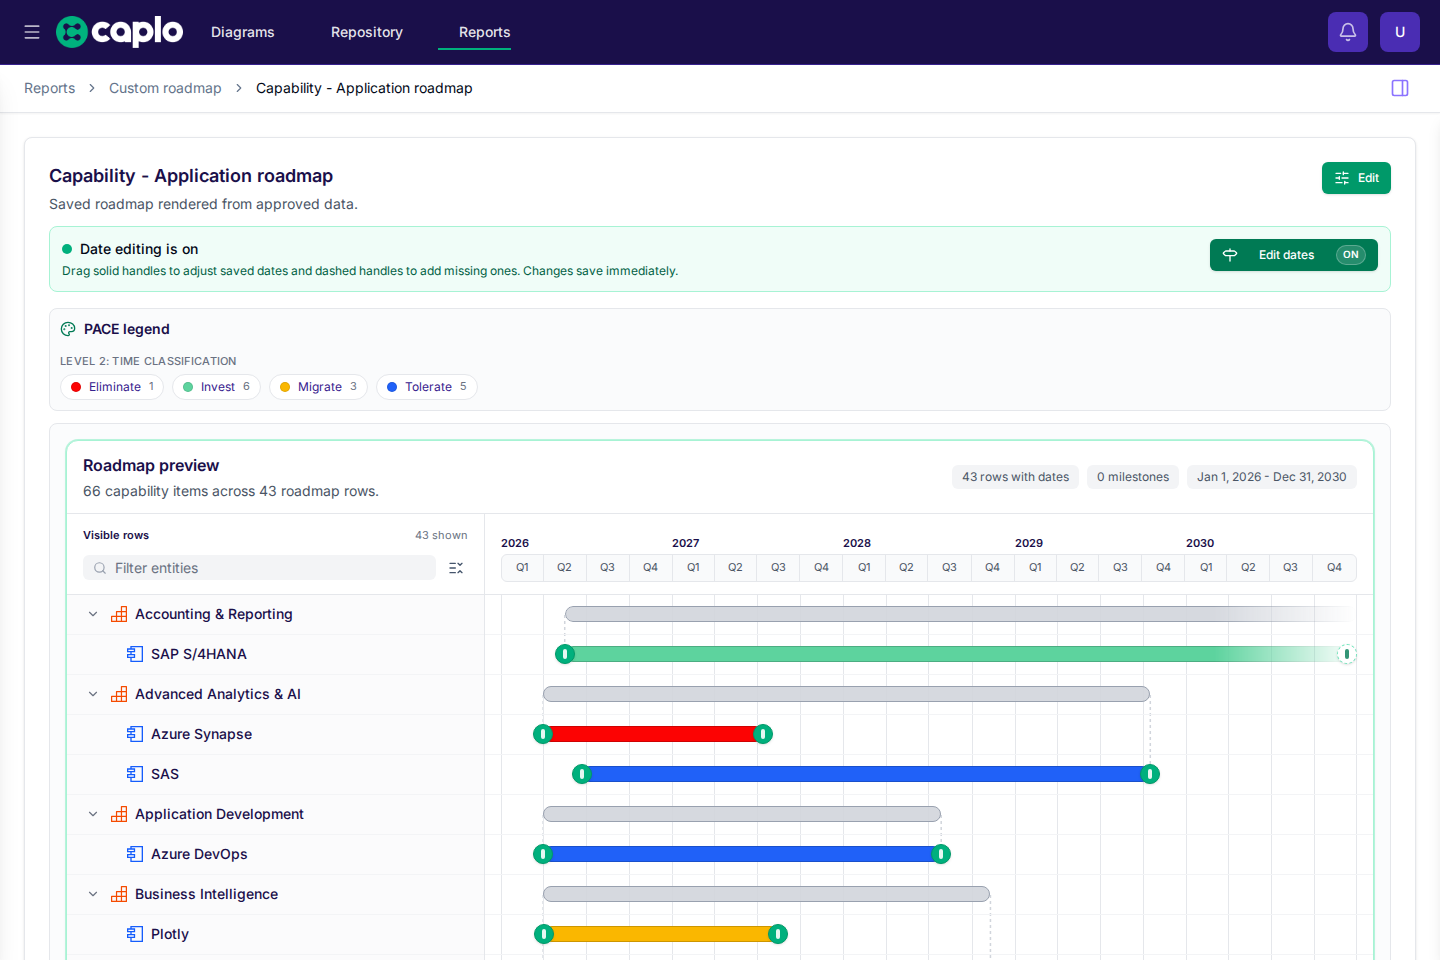
In timeline edit mode:
- Drag a solid handle to move an existing start or end date.
- Drag a dashed handle to create a missing configured date.
- Changes save immediately back to the entity metadata.
This is especially useful when you are setting up lifecycle dates for applications and want to work through the roadmap row by row.
Coloring and saving
Like landscape reports, roadmap reports can color each configured layer by a metadata field such as PACE or lifecycle category. Save the roadmap once the path, timing fields, coloring, and viewport are stable so teammates can reopen the same view without rebuilding it.