Reports overview
Reports turn repository data into structured insight. Use them when you need to compare, group, filter, or explain architecture data without manually drawing a canvas.
Caplo includes built-in reports and custom report builders.
Built-in reports
Built-in reports help with common architecture questions:
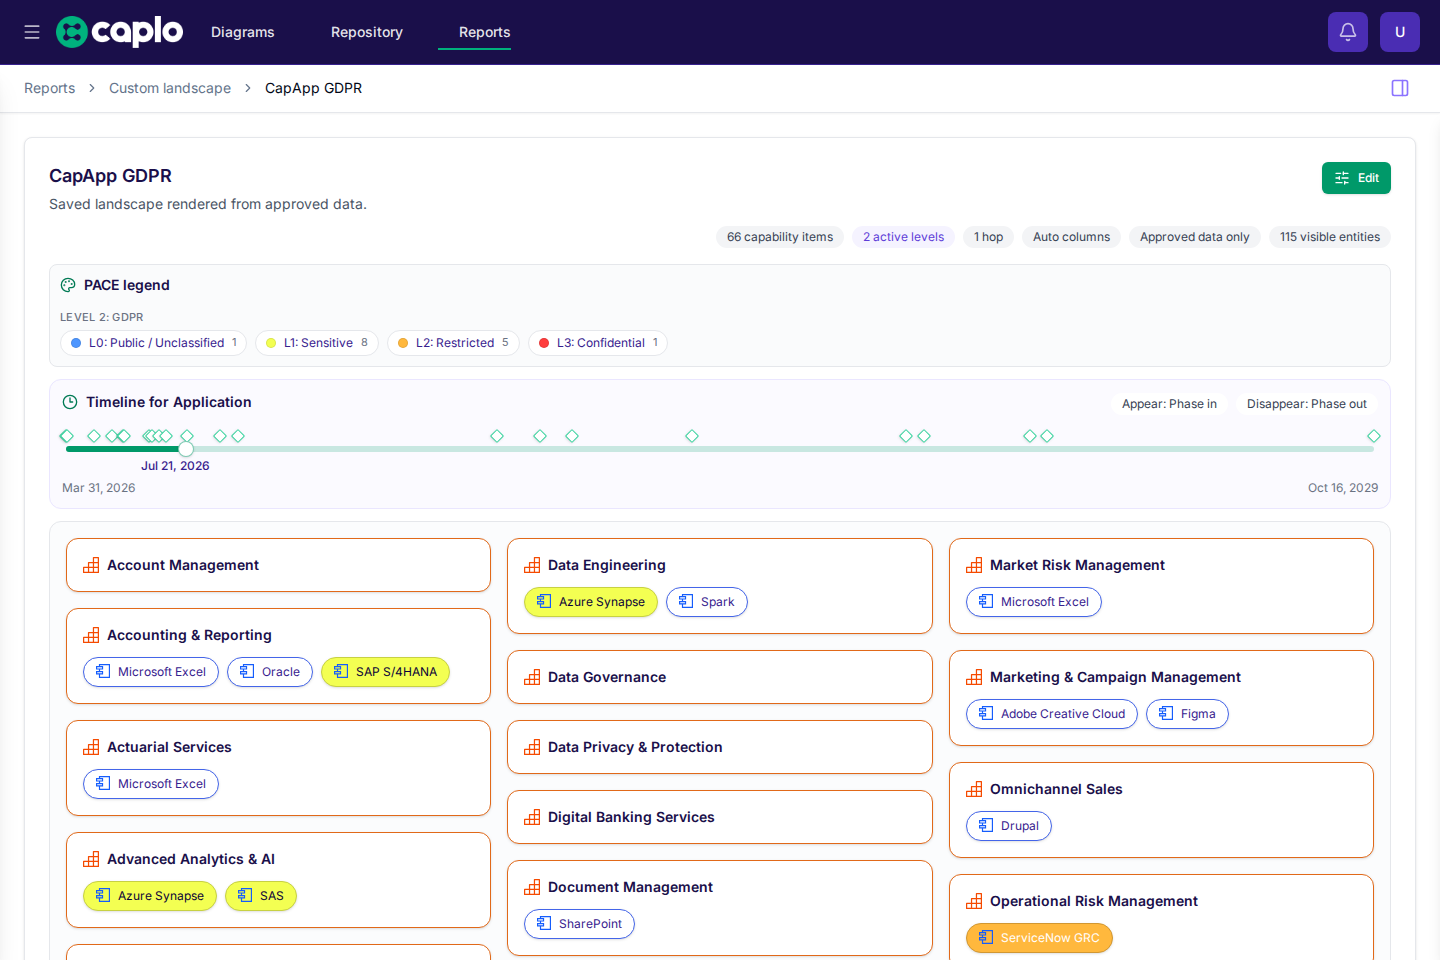
- Application lifecycle timeline shows phase-in and phase-out timing so you can spot lifecycle risk.
- Application portfolio bubble chart compares applications across numeric dimensions such as value, cost, risk, or fit.
- Application landscape maps applications against capabilities or other organizing layers.
- Application cost per capability summarizes application cost across related capabilities.
These reports are best when your repository already contains reasonably complete application metadata and relations.
The same reporting patterns also support broader use cases such as application portfolio management, merger planning, data sovereignty reviews, and compliance tracking when your repository includes the right properties and relations.
Report interactions
Reports are connected to the repository. Clicking an entity in a report can open its details, so analysis and cleanup can happen together.
If a report reveals missing or inconsistent data, update the repository rather than patching the report manually.
Built-in reports are strongest when application metadata and relations are already in good shape. If a report looks thin or inconsistent, treat it as feedback on the repository and clean up the source data first.
Relation paths and hop count
Custom landscape and roadmap reports, plus bar charts that group by related entities, can all follow repository relations instead of only grouping by fields on the current entity type. In each case, the selected path, direction, and hop count determine which related entities Caplo can reach.
Relation-path traversal can also include derived relations from Mermaid and BPMN diagrams when diagram elements are linked to repository entities.
Direction matters because Caplo stores most reusable relation types from the lower, more detailed, or supporting side toward the higher, more abstract, or consuming side.
Examples:
- Application -> Capability for Realizes
- Data object -> Application for Accessed by
- Source application -> Target application for Flows
- Triggering process -> Triggered process for Triggers
Use top-down when you start from the higher-level item and want to find supporting items beneath it. Example: Capability > Application.
Use bottom-up when you start from the lower-level item and want to move toward the higher-level item it supports. Example: Application > Capability.
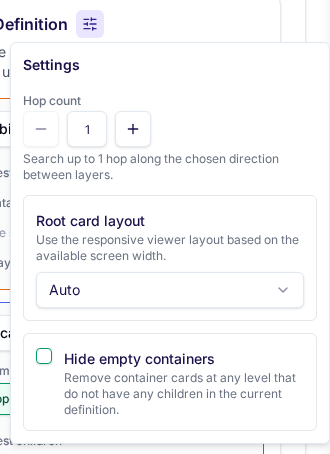
Hop count controls how many relation steps Caplo can follow between layers or buckets. 1 hop means directly connected matches only. Higher hop counts allow intermediate entities when the business question needs a longer path.
Landscape and roadmap reports also support a per-layer Auto nest children option. When it is on, Caplo renders downstream Child of descendants as extra nested levels before the next configured layer. This is useful when you want to preserve a hierarchy such as capability -> sub-capability -> application without configuring every intermediate level explicitly.
Auto nest children does not replace hop count. Caplo still respects the configured hop count when matching the next configured layer, and bar charts do not use this option.
If a report feels empty or surprising, check the path, direction, hop count, and filters before assuming the source data is missing.
Filtering and timelines
Reports can use filters to focus the dataset. Timeline controls help show what is active at a point in time, which is useful for lifecycle, roadmap, and transformation planning.
Saving and sharing
Custom reports can be saved under Personal or Shared. Use Personal while experimenting with layers and filters. Move to Shared when the report is stable enough for team use.
Good reporting habits
- Start from a decision you need to support.
- Keep the report title specific.
- Use filters to make the result understandable.
- Document assumptions in the report description when needed.
- Treat surprising results as a prompt to improve repository data.