Getting started
This guide walks through the shortest useful path: sign in, set up your workspace, create a few repository items, use them in a diagram, and turn them into a report.
1. Sign in
Create your account or sign in with the method configured for your organization. After signing in, Caplo opens the workspace you last used or the first workspace available to you.
Open the Overview from the Caplo logo or the menu button in the top bar. If you belong to multiple workspaces, use the workspace switcher in the Overview header to move between them.
2. Complete your company profile
Open Settings > Company profile and add your company website and profile information. This gives teammates and the AI assistant better context about your organization, industries, initiatives, and operating model.
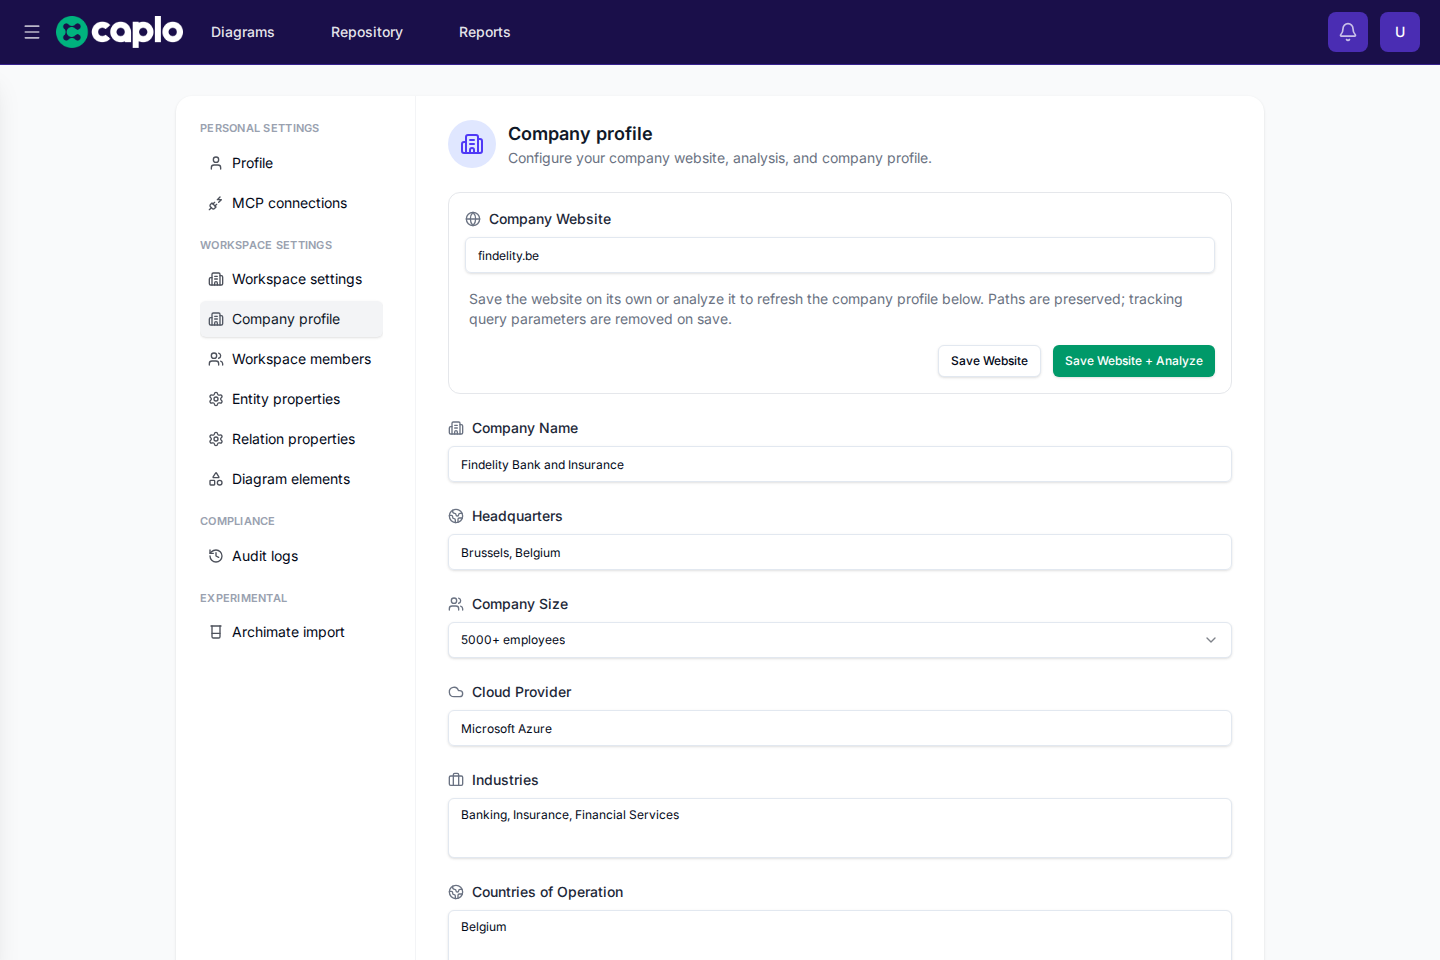
Keep the profile high level. It should explain the business context, not replace the repository.
The repository stays the source of truth for applications, capabilities, processes, data objects, and relations. The company profile is most useful early on, when the repository is still small and the assistant needs more organizational context.
3. Create your first entity
Open Repository and create an entity such as an application, capability, process, data object, or vendor. You can also create entities while modeling in a diagram, but the Repository is the easiest place to start deliberately.

To create a brand-new entity from a diagram, choose a shape tool such as Capability, drag a new shape onto the canvas, and start typing the name.
A good first entity has:
- A clear name that others would recognize.
- A full name instead of a local abbreviation. If an abbreviation matters, explain it in the description or properties.
- A type that reflects what it represents. If you are unsure, ask the AI assistant for help choosing the closest fit.
- A short description or key metadata properties when helpful.
For an application inventory, start with a handful of important applications before adding every system.
4. Add relations
Relations explain how entities fit together. For example, connect an application to the capability it supports, the data object it uses, or the vendor that provides it.
When you already know the structure, add the reusable relation directly from the Repository.

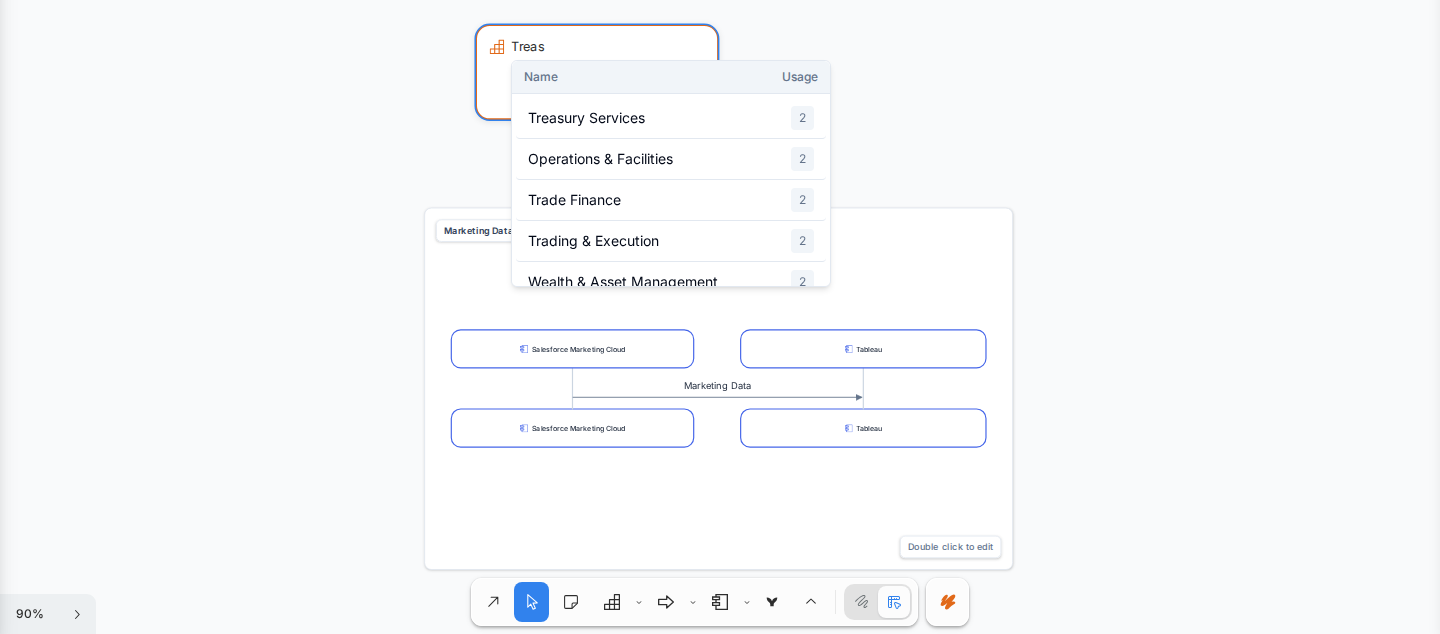
When you are modeling visually, drag entities from the repository sidebar onto the canvas. Then switch to the arrow tool and use the Relations tab in the right sidebar while you connect or inspect repository-backed shapes.
5. Create your first diagram
Open Diagrams and create a diagram for a focused question, such as “How does customer onboarding work?” or “Which applications support Finance?”
Drag existing repository entities onto the canvas when possible. This keeps diagrams connected to the shared repository instead of creating one-off labels.
As you refine the diagram, double-click a shape label to rename it inline and use the right panel to edit the selected entity or relation in more detail.
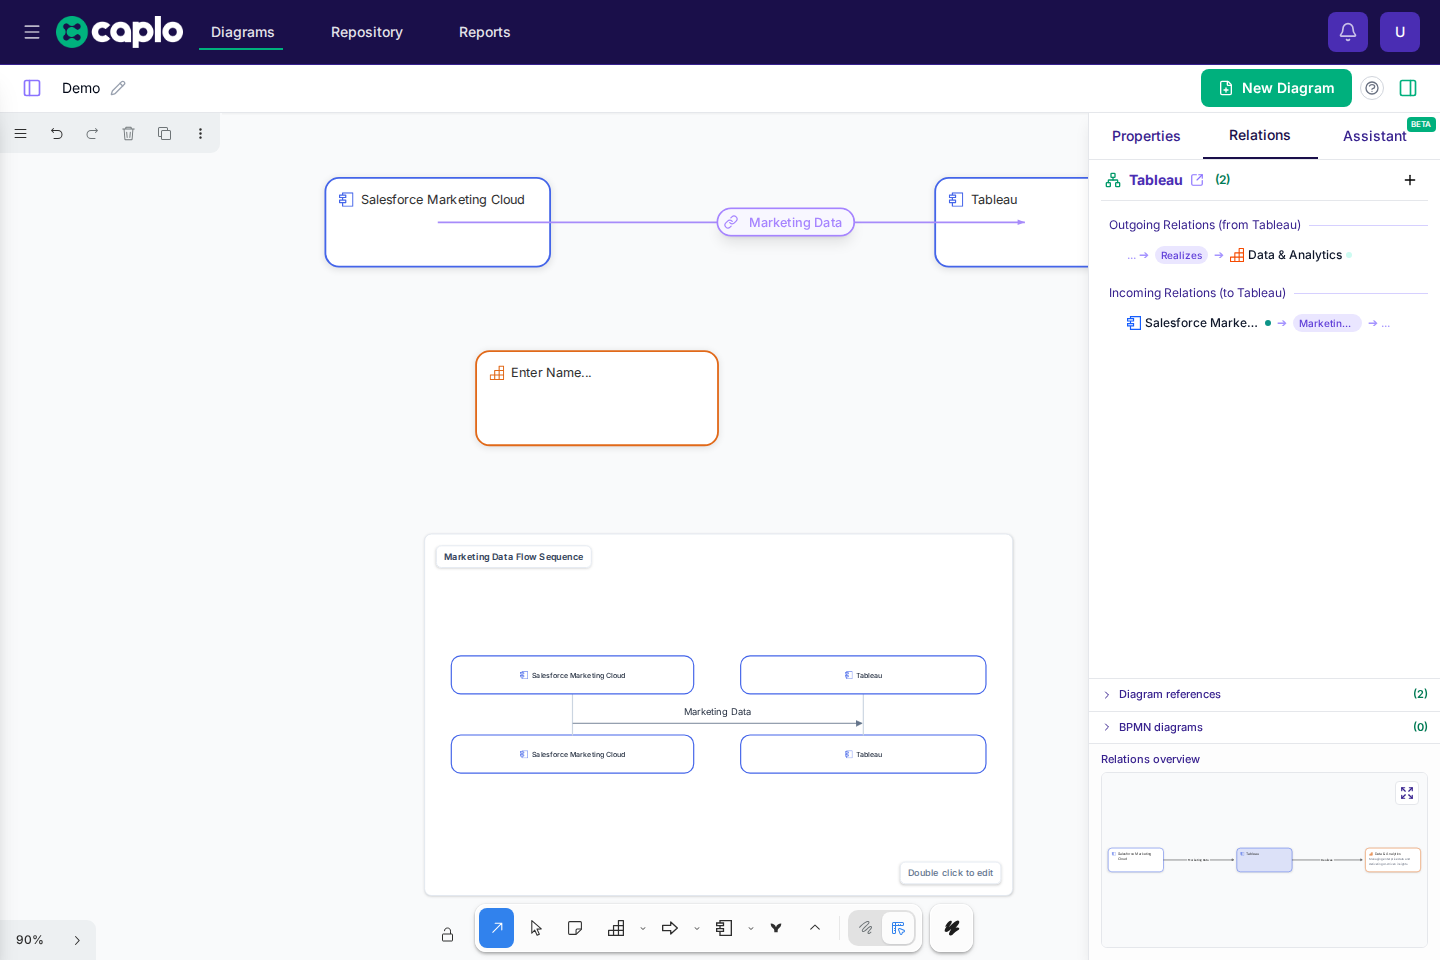
6. Build your first report
Open Reports and start with a built-in report such as Application landscape or Application cost per capability.
Change a filter, layer, or grouping so it answers a real question for your audience. If the result is useful, save it as a custom report instead of rebuilding it later.
7. Share work with your team
Use Personal for drafts and private exploration. Use Shared when a diagram, repository view, or report should be visible to the workspace.
Before sharing, check that names are clear, important entities are approved, and the view answers a real question.